
periodic-table-cli is an interactive periodic table of elements program for the console.
The periodic table, in chemistry, is the organized array of all the chemical elements in order of increasing atomic number —i.e., the total number of protons in the atomic nucleus.
This is free and open source software.
Key Features
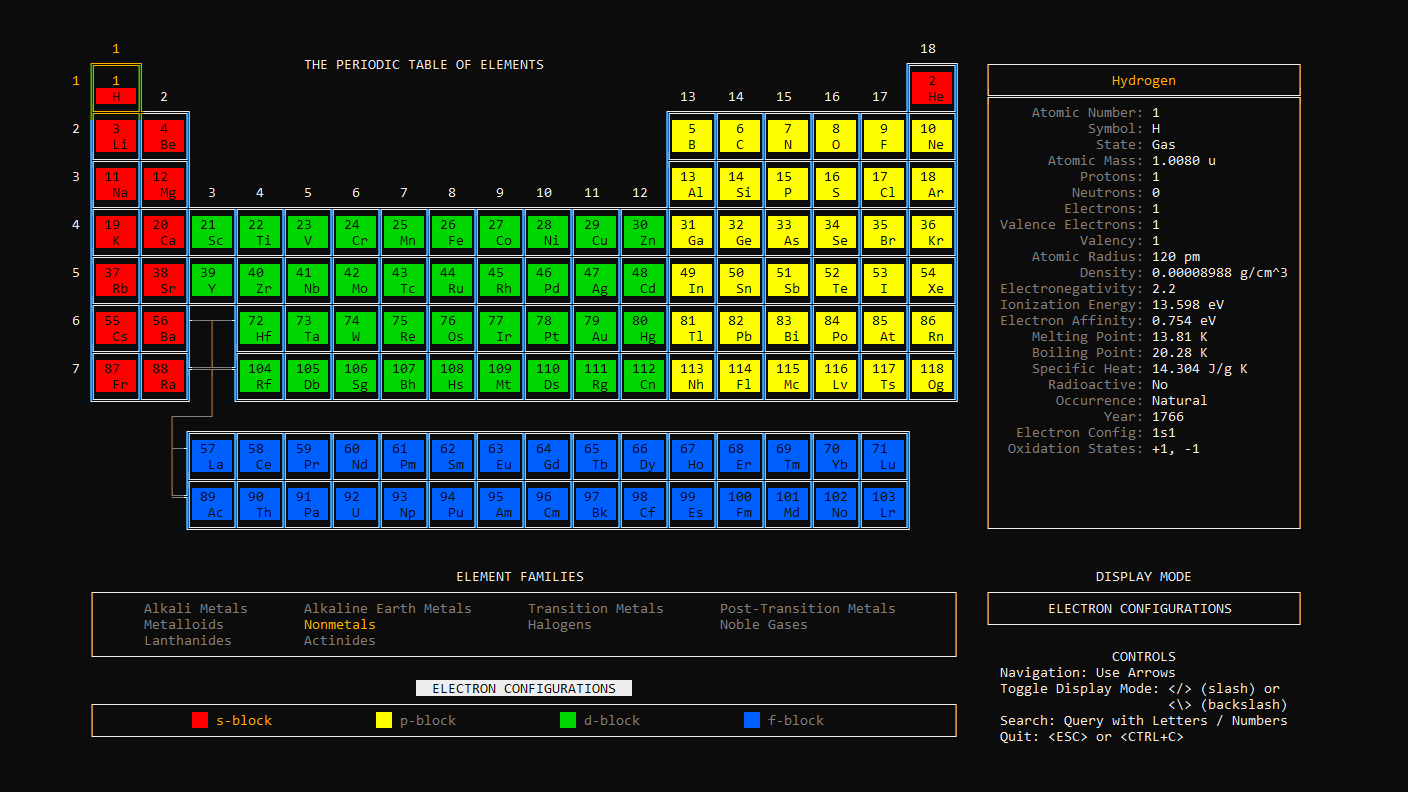
- Use the arrow keys to navigate and browse across all 118 elements. The selected element appears in gold on the Periodic Table on the left, and 22 data points for that element will display on the right.
- Browse all 10 element families.
- Browse all 4 electron configurations.
- Search – use letters or numbers to query for an element, family, or electron configuration. Queries are matched on element names, symbols, and atomic numbers, along with family names and electron configuration names.
- Display modes:
- Element families – 10 color-coded element families.
- Electron configurations – 4 color-coded electron shell.
- Standard state – display whether an element is a solid (white), liquid (red), or gas (blue).
- Atomic mass – heat-map of atomic mass (increasing from blue to red).
- Protons – heat-map of the number of protons (increasing from blue to red).
- Neutrons – heat-map of the number of neutrons (increasing from blue to red).
- Electrons – a heat-map of the number of electrons (increasing from blue to red).
- Valence electrons – a color-coded representation of the number of valence electrons.
- Valency – color-coded representation of valency
- Atomic radius – heat-map of atomic radius (increasing from blue to red).
- Density – heat-map of density (increasing from blue to red).
- Electronegativity – heat-map of electronegativity (increasing from blue to red)
- Ionization energy – heat-map of ionization energy (increasing from blue to red).
- Electron affinity – heat-map of electron affinity (increasing from blue to red).
- Melting point – heat-map of melting point (increasing from blue to red).
- Boiling point – heat-map of boiling point (increasing from blue to red).
- Specific heat – heat-map of specific heat (increasing from blue to red).
- Radioactivity – display which elements are radioactive (red) and stable (green).
- Occurrence – display which elements have a natural occurrence (blue), rare occurrence (orange), or artificial occurrence (yellow).
- Year – heat-map of the year each element was discovered (increasing from blue to red). Ancient elements appear in white.
- Data mode – displays a brief list of all the elements, including atomic number, element symbol, and element name.
- Chart mode – prints a non-interactive Periodic Table of Elements.
Website: spirometaxas.com/projects/periodic-table-cli
Support: GitHub Code Repository
Developer: Spiro Metaxas
License: MIT License
periodic-table-cli is written in JavaScript. Learn JavaScript with our recommended free books and free tutorials.
Related Software
| Periodic Table Tools | |
|---|---|
| periodic-table-cli | Interactive periodic table of elements app for the console |
| Nucleus | Browse the chemical elements |
| Kalzium | Full-featured chemistry application for KDE 5 |
| P-Table | Beautiful TUI periodic table for Linux terminals coded in C |
| Periotable | Modern periodic table app |
| multiElement | Alternative versions of the periodic table of chemical elements |
| element | Periodic table on the command line |
Read our verdict in the software roundup.
 Explore our comprehensive directory of recommended free and open source software. Our carefully curated collection spans every major software category. Explore our comprehensive directory of recommended free and open source software. Our carefully curated collection spans every major software category.This directory is part of our ongoing series of informative articles for Linux enthusiasts. It features hundreds of detailed reviews, along with open source alternatives to proprietary solutions from major corporations such as Google, Microsoft, Apple, Adobe, IBM, Cisco, Oracle, and Autodesk. You’ll also find interesting projects to try, hardware coverage, free programming books and tutorials, and much more. Discovered a useful open source Linux program that we haven’t covered yet? Let us know by completing this form. |