
Last Updated on April 19, 2026
In Operation
s-tui offers two separate modes. The default mode lets you monitor your system. The other mode stresses your system.
You can toggle between the monitoring and stress mode using the radio buttons in ‘Modes’.
For either mode, the left hand column offers various control options. For example, the graphs option lets you enable/disable each of the entries shown in the Summaries section. To the right of this information are three charts.
Monitor mode
Here’s an image of the monitor mode in action.
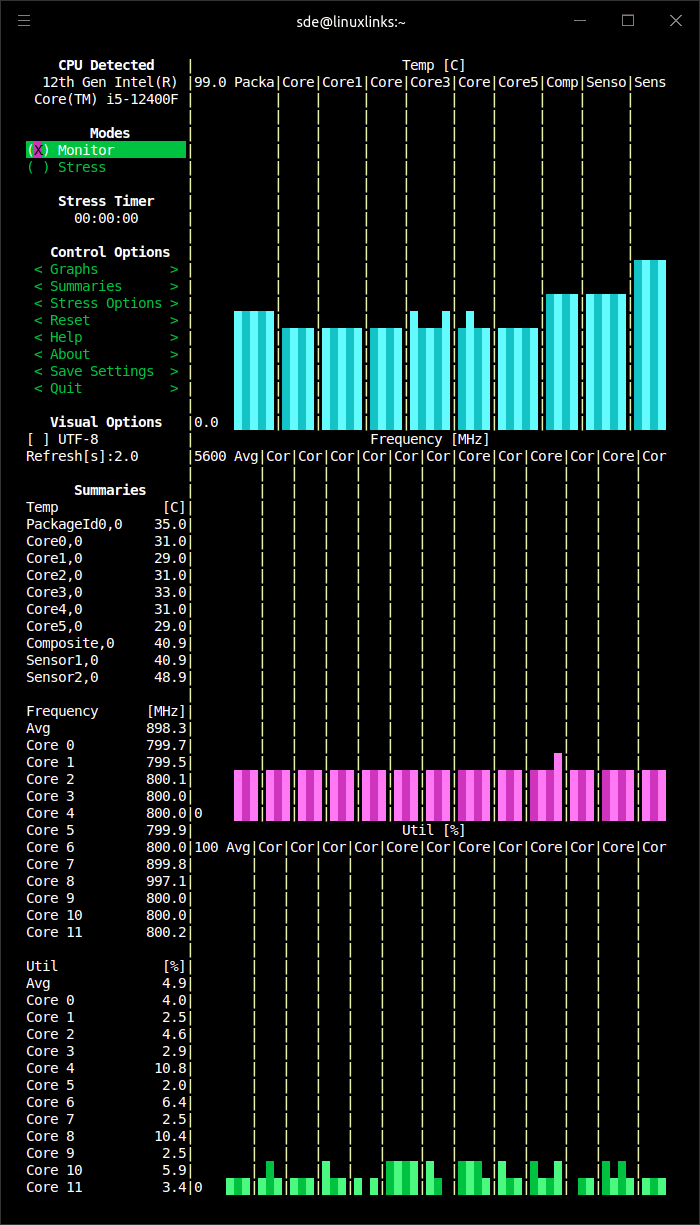
The top chart displays the temperature of each of the CPU cores together with a few other sensors. The machine is running an Intel i5-12400F CPU which has 6 cores, 12 threads.
On this particular test system, Sensor2,0 seems to be reporting a fairly high temperature, so this warrants investigation.
When this image was taken, the machine was under a very light load.
This is evident from the second chart as all the i5-12400F’s cores are running at their lowest frequency, 800 MHz.
The third chart shows the utilization of each core, and the average across all the cores.
The utilization of each core needs to be taken in context.
Bear in mind in this example, the cores are all running at their lowest frequency.
Stress mode
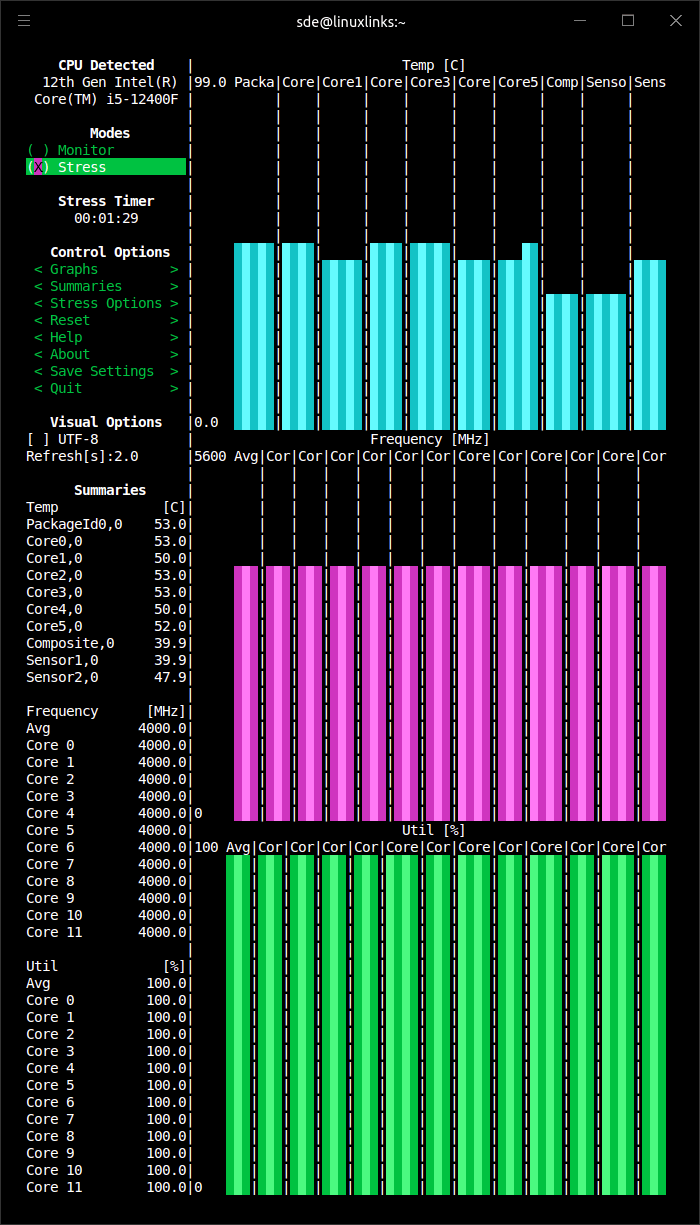
The next image shows the stress mode in action.
There’s a timer showing how long the system has been running in stress mode.
As you can see, despite all the cores running flat out, system temperatures remain low on our test system. The machine has sufficient cooling aided by a splendid be quiet! Shadow Rock 3 air CPU cooler which not only is extremely good at cooling the 12400F CPU, it’s also frightfully quiet even under high load.
Our test system doesn’t display any performance dips from thermal throttling. But if your system is suffering from this issue, s-tui will help identify it.
There are various stress options available including a time out, configurable sqrt() worker count, sync() worker count, malloc() / Free() work count, Bytes per malloc, and more.
Summary
s-tui is a useful monitoring tool for any Linux machine. The software is easy to install and runs without requiring to fiddle around with pesky config files.
We like that the software lets you run arbitrary shell scripts when a CPU temperature threshold is exceeded. We look forward to more threshold hooks being added.
If you want to monitor processes, you’ll need a different tool. Our Alternatives to top roundup summarizes the best free and open source process monitors.
Website: amanusk.github.io/s-tui
Support: GitHub Code Repository
Developer: Alex Manuskin, Gil Tsuker, Maor Veitsman and other contributions
License: GNU General Public License v2.0
s-tui is written in Python. Learn Python with our recommended free books and free tutorials.
Pages in this article:
Page 1 – Introduction and Installation
Page 2 – In Operation and Summary
Related Software
| Benchmark Tools | |
|---|---|
| hyperfine | Rust-based command-line benchmarking tool |
| Phoronix Test Suite | Comprehensive testing and benchmarking platform |
| s-tui | Terminal-based stress test and monitoring tool |
| fio | Scriptable I/O tool for storage benchmarks and drive testing |
| KDiskMark | HDD and SSD benchmarking with friendly graphical user interface |
| iperf3 | Active measurement of network performance on IP networks |
| IOzone | Filesystem benchmark tool |
| stress-ng | Stress next generation |
| Hardinfo2 | System information and benchmark tool |
| sysbench | Scriptable database and system performance benchmark |
| GtkStressTesting | Stress and monitor hardware components |
| glmark2 | Measure the performance of OpenGL 2.0 and OpenGL ES 2.0 |
| HardInfo | System Profiler and Benchmark |
| UnixBench | Original BYTE UNIX benchmark suite |
| netperf | A network performance benchmark |
| vkmark | Vulkan benchmarking suite |
| GNOME Disks | View, modify and configure disks and media |
| bonnie++ | Benchmark suite software |
| LLCbench | Low Level Architectural Characterization Benchmark Suite |
Read our verdict in the software roundup.
 Explore our comprehensive directory of recommended free and open source software. Our carefully curated collection spans every major software category. Explore our comprehensive directory of recommended free and open source software. Our carefully curated collection spans every major software category.This directory is part of our ongoing series of informative articles for Linux enthusiasts. It features hundreds of detailed reviews, along with open source alternatives to proprietary solutions from major corporations such as Google, Microsoft, Apple, Adobe, IBM, Cisco, Oracle, and Autodesk. You’ll also find interesting projects to try, hardware coverage, free programming books and tutorials, and much more. Discovered a useful open source Linux program that we haven’t covered yet? Let us know by completing this form. |
Thanks you very much, was looking for this kind of utility to test a CPU replacement in my system.
I like s-tui too.