
Icinga is a monitoring system which checks the availability of your network resources, notifies users of outages, and generates performance data for reporting.
Scalable and extensible, Icinga can monitor large, complex environments across multiple locations.
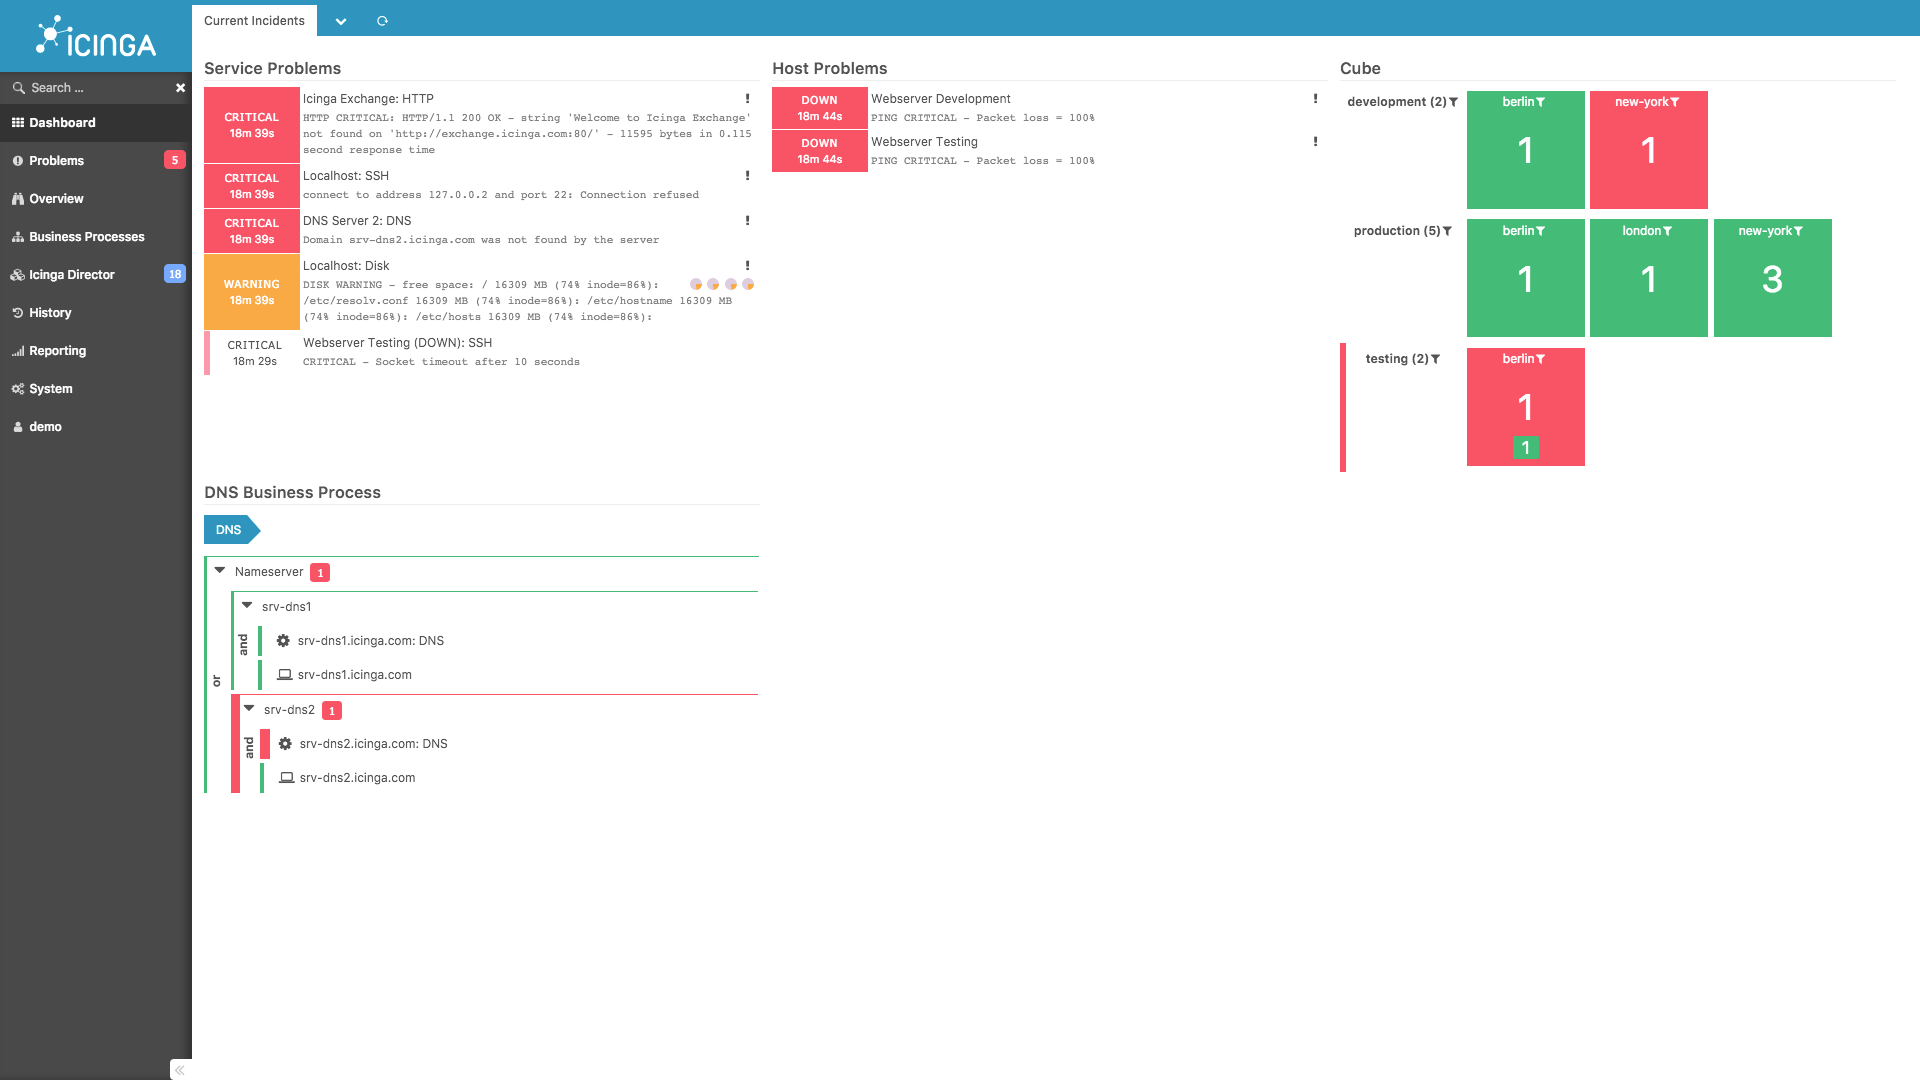
Icinga 2 is the monitoring server and requires Icinga Web 2 on top in your Icinga Stack. The configuration can be managed with either the Icinga Director, config management tools or plain text within the Icinga DSL.
Key Features
- Logging. 3 different types of logging are supported:
- File logging.
- Syslog.
- Console logging.
- Log rotation
- Core Backends:
- Rest API
- Icinga DB – provides a new core backend and aims to replace the IDO backend output. It consists of different components.
- IDO Database – takes care of exporting all configuration and status information into a database. The IDO database is used by Icinga Web 2 as data backend.
- Metrics – collect, store, visualize and combine performance and metrics data on the way. Data is parsed by features sending metrics to time series databases (TSDB):
- Graphite.
- InfluxDB.
- OpenTSDB.
- Notifications – notifies you when it makes sense through any channel you want.
- Analytics – discover relations and patterns. Create reports with your existing data for different aspects. Filter certain servers/VMs to get dedicated insights.
- Integrations – collects and sends data from and to many of your existing DevOps tools, enabling you to create a tailored monitoring solution that perfectly fits your needs.
Website: icinga.com
Support: GitHub Code Repository
Developer: Icinga GmbH
License: GNU General Public License v2.0
Icinga is written in C++. Learn C++ with our recommended free books and free tutorials.
Related Software
| System Monitoring Tools | |
|---|---|
| Prometheus | Systems and service monitoring system |
| Nagios | Host and service monitor designed to inform you of network problems |
| OpenNMS | Enterprise grade network monitoring platform |
| LibreNMS | Fully featured network monitoring system |
| SigNoz | Monitor your applications and troubleshoot problems |
| ZABBIX | All-in-one 24x7 free monitoring solution |
| Jaeger | Distributed tracing system |
| Beszel | Lightweight server monitoring platform |
| Loki | Horizontally-scalable, highly-available, multi-tenant log aggregation system |
| Cockpit | Sysadmin login session in a web browser |
| Monit | Utility for managing and monitoring processes, files, directories and filesystems |
| HyperDX | Cloud-based production monitoring and debugging tool |
| NetXMS | Network and infrastructure monitoring and management system |
| FreeNATS | Automatic network status testing, alerting and reporting package |
| Cacti | Web-based frontend to RRDtool |
| Monitorix | Lightweight system monitoring tool |
| Icinga | Monitoring platform with a powerful configuration language |
| Checkmk | IT monitoring platform |
| Munin | Networked resource monitoring tool designed to be plug and play |
| Shinken | Flexible and scalable monitoring framework |
| Pandora FMS | Flexible monitoring system |
| Xymon | System for monitoring of hosts and networks |
| Mon | General-purpose problem alerting system |
Read our verdict in the software roundup.
 Explore our comprehensive directory of recommended free and open source software. Our carefully curated collection spans every major software category. Explore our comprehensive directory of recommended free and open source software. Our carefully curated collection spans every major software category.This directory is part of our ongoing series of informative articles for Linux enthusiasts. It features hundreds of detailed reviews, along with open source alternatives to proprietary solutions from major corporations such as Google, Microsoft, Apple, Adobe, IBM, Cisco, Oracle, and Autodesk. You’ll also find interesting projects to try, hardware coverage, free programming books and tutorials, and much more. Discovered a useful open source Linux program that we haven’t covered yet? Let us know by completing this form. |