
Last Updated on September 26, 2020
In Operation
Termgraph offers a variety of different graphs. Before you can create a graph, you’ll need to create a data file. For a simple barchart, create a plain text file with two columns, which can either be comma or space separated. The first column holds the labels, the second column hosts the numeric data. There’s a few examples in the project’s GitHub repository.
Bar Graphs
Here’s a simple bar graph generated with Termgraph. The image shows the command flags used together with the output.
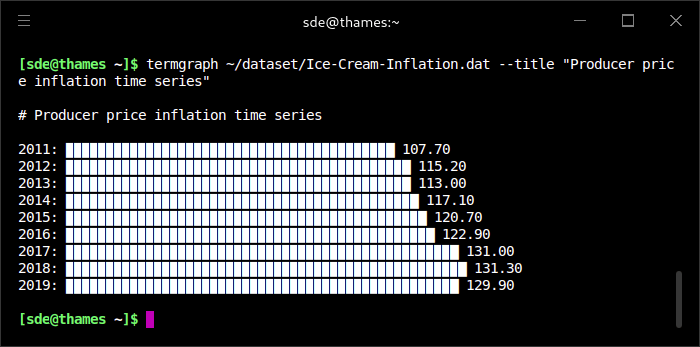
If you’re wondering why the bars are not solid white, that’s an effect caused by Hyper, an Electron-based terminal emulator.
Color charts
White on black looks rather basic. How about we add some color to the chart?
To generate a color chart, we need to include the --color flag.
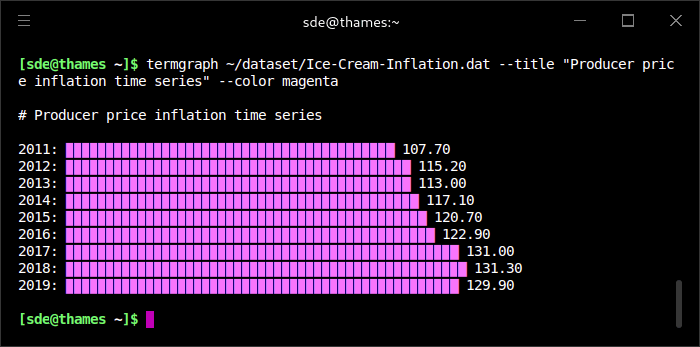
There’s a fairly limited range of colors available. We can choose from red, blue, green, magenta, yellow, black, and cyan.
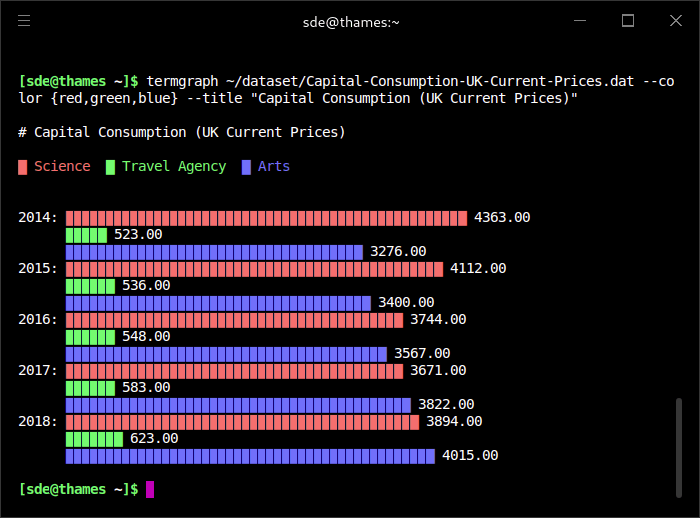
Multi-variable
Things get a bit more interesting with multi-variable datasets.
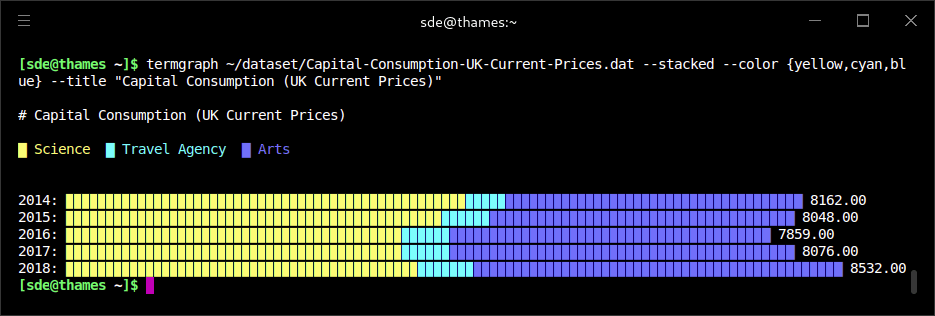
Stacked charts
One of our favorite charts is the stacked chart. Here’s an example.
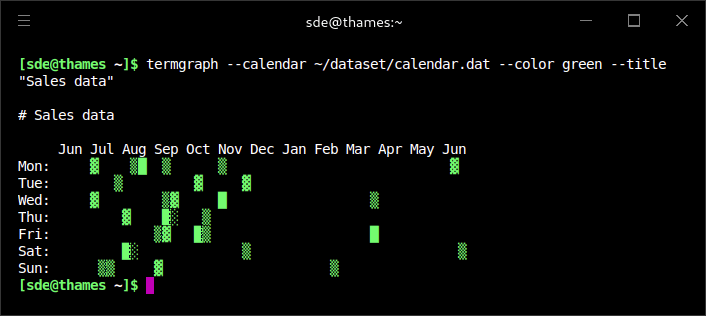
Calendar
We probably won’t use the calendar graph often, but it might be useful for some occasions.
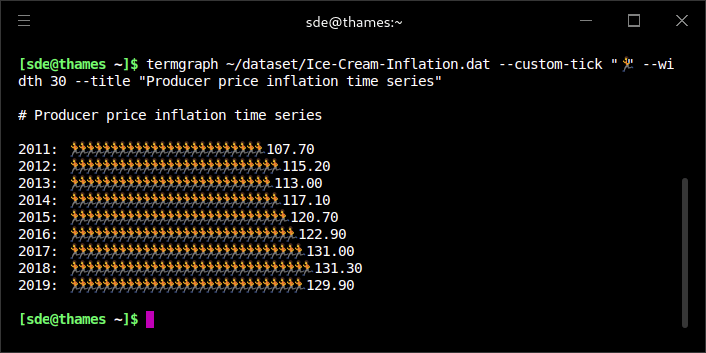
Emoji!
Add a bit of fun to charts with emojis.
Pages in this article:
Page 1 – Introduction / Installation
Page 2 – In Operation
Page 3 – Summary