
Last Updated on March 24, 2022
In Operation
Here’s an image of mop in action.
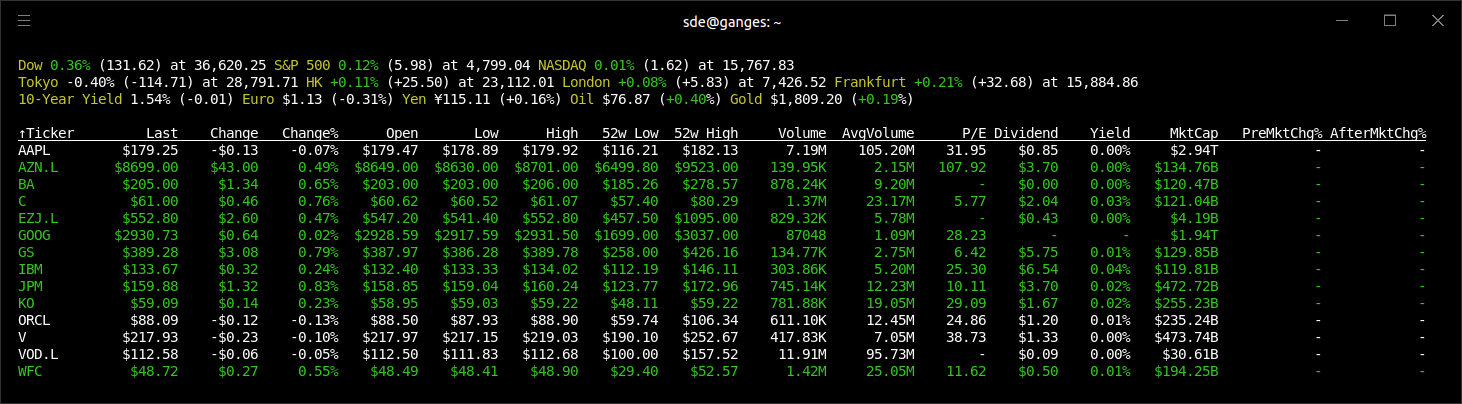
The first two lines show the position of the major stock market exchanges. The third line provides information about 10 year yield rates, a couple of exchange rates, and a couple of commodity prices. These three lines are hard-coded into the program.
Below the hard-coded information are a list of various stocks. It’s easy to add and delete tickers – you’ll need to know the ticker code.
Publicly traded companies on the stock market are identified by their stock ticker symbol, which is a unique set of letters, numbers, or both. Publicly traded companies are allowed to trade on several different stock exchanges. However, no two companies will share the same stock ticker symbol on one stock exchange. For example, AstraZeneca PLC trades on the Nasdaq with the stock ticker AZN, trades on the London Stock Exchange with the stock ticker AZN.L, and trades on the Stockholm Stock Exchange with the ticker AZN.ST.
As you can see from the image above, we’ve added 3 stocks traded on the London Stock Exchange (they are AZN.L, EZJ.L and VOD.L). mop shows these stocks with dollar information. That’s incorrect. These stocks are denominated in pounds sterling. mop erroneously shows dollar prices regardless of the exchange. We have raised this bug on the project’s GitHub page. UPDATE 12 January 2022: Bug has been fixed.
Filtering expression
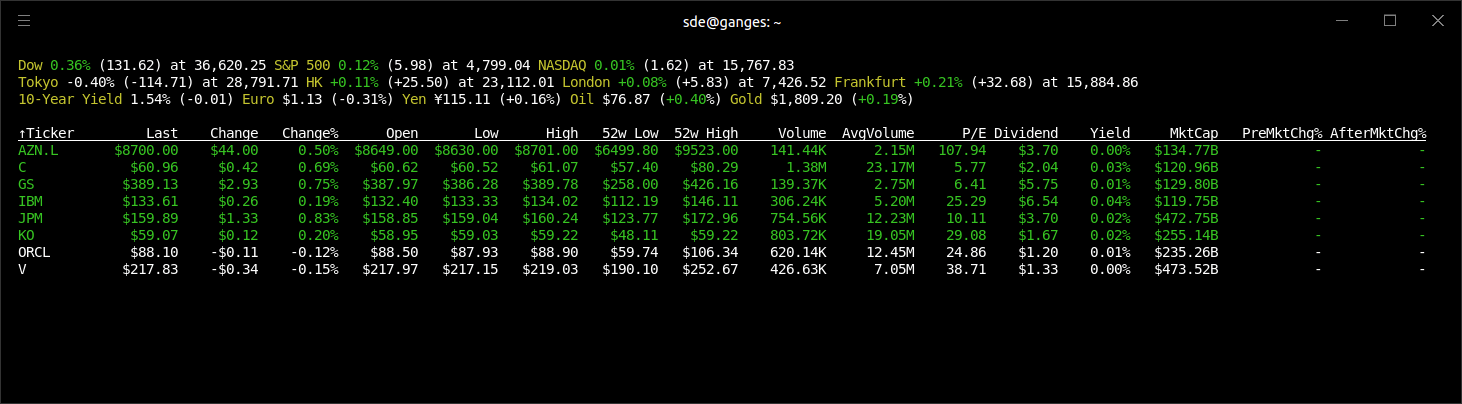
One of the strengths of mop is its realtime expression-based filtering engine. The engine is accessed by pressing f, then typing an expression which can be based on any of the columns. In the image below, we entered the expression dividend>1. Only stocks with dividends greater than 1 dollar are displayed. The filtering options are powerful with modifiers, comparators, logical ops, and more supported.
Column sort order
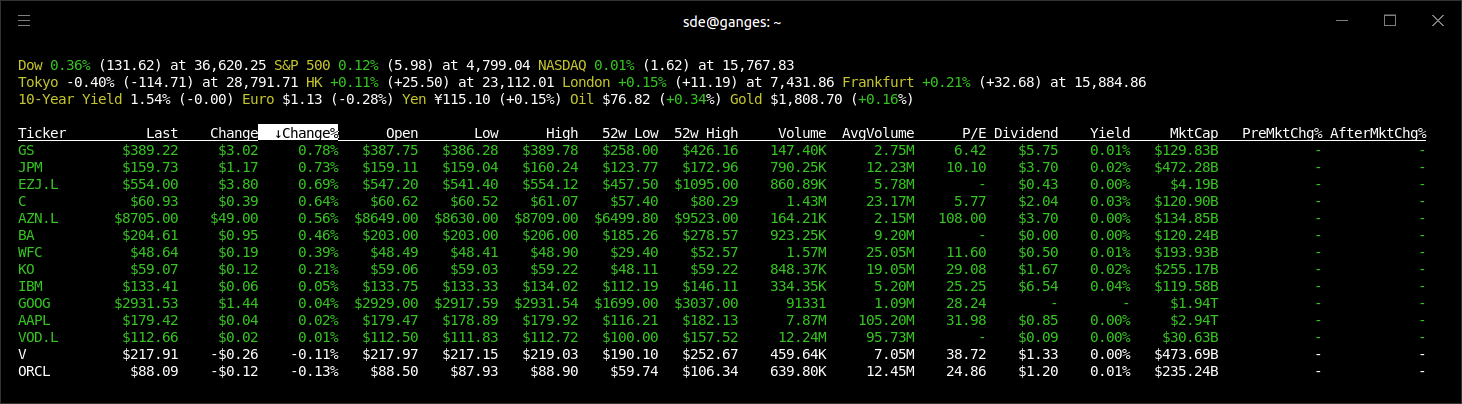
Another useful feature is the ability to sort stocks by a specific column. For example, the image below shows stocks sorted by the % price change. Ascending and descending sorting is supported.
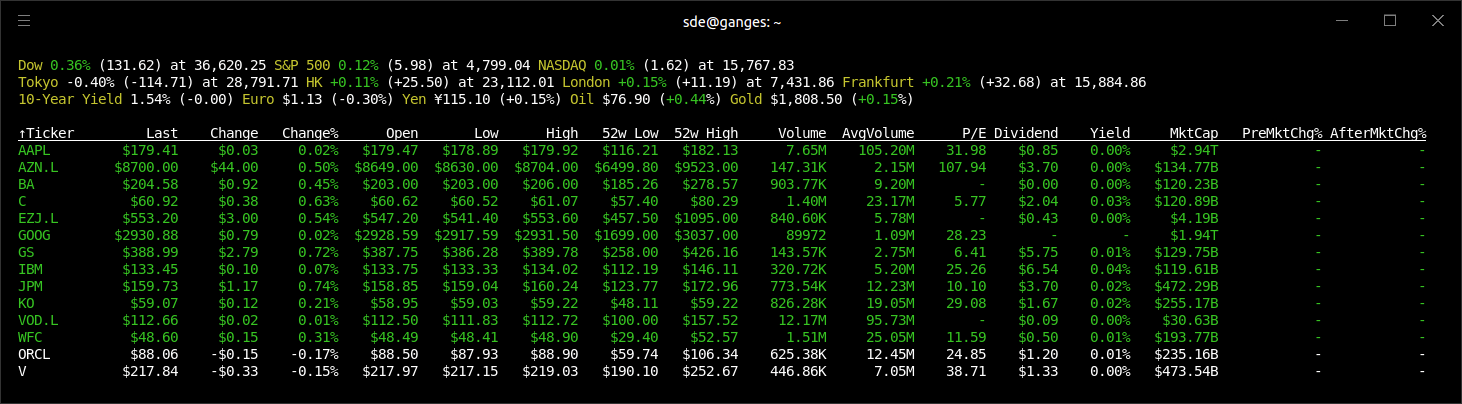
Grouped
We can also group stocks.
Pages in this article:
Page 1 – Introduction / Installation
Page 2 – In Operation
Page 3 – Summary