Last Updated on September 1, 2020
In operation
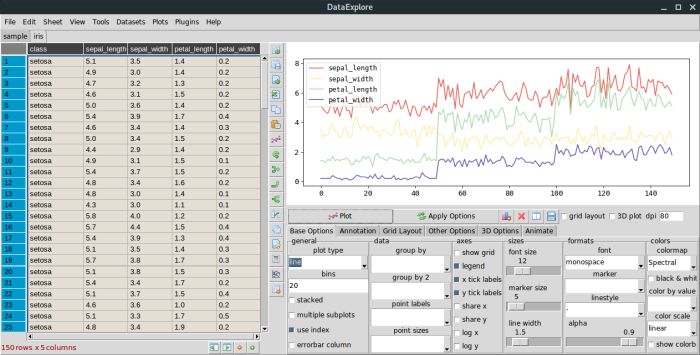
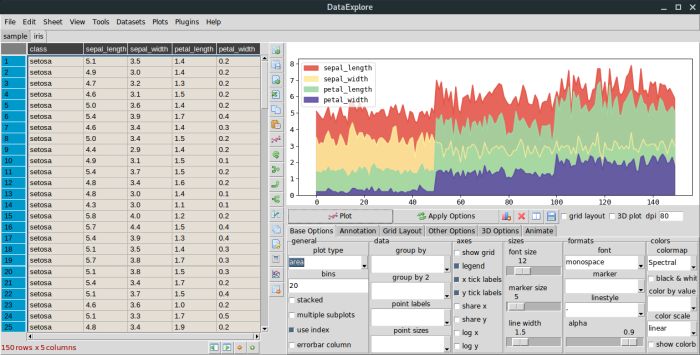
The application consists of a table and associated plot viewer.
The software comes supplied with data sets including the famous Iris flower data set, a multivariate data set introduced by the British statistician and biologist Ronald Fisher, a Titanic data set, and others. The data sets offer a quick way to experiment with the software and learn about its capabilities.
Plot options are laid out in a set of tabbed control panels below the plot allowing the user to switch quickly between basic and other plotting modes. Plots are generated dynamically from the currently selected data and chosen options.
The software offers advanced plotting with a simple interface. There’s a good range of plot types available. Here’s examples of line and area plots:
Line plot
Area plot
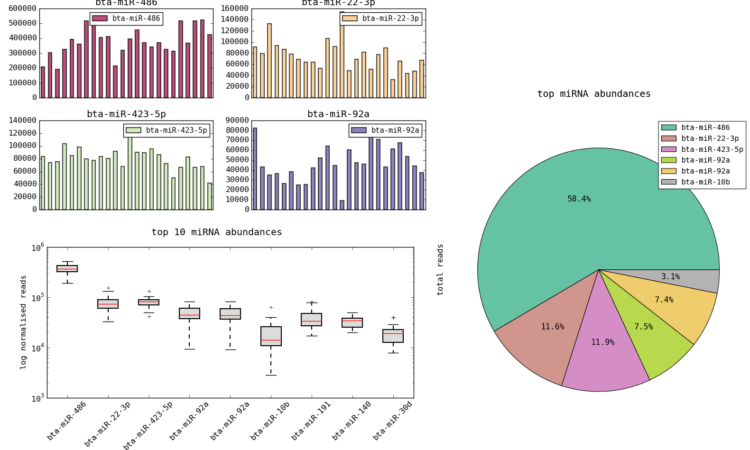
The other plot types available are scatter, bar, horizontal bar, pie, histogram, box plot, dot plot, heatmap, hexbin, contour, imshow, scatter matrix, density, radviz, and venn.
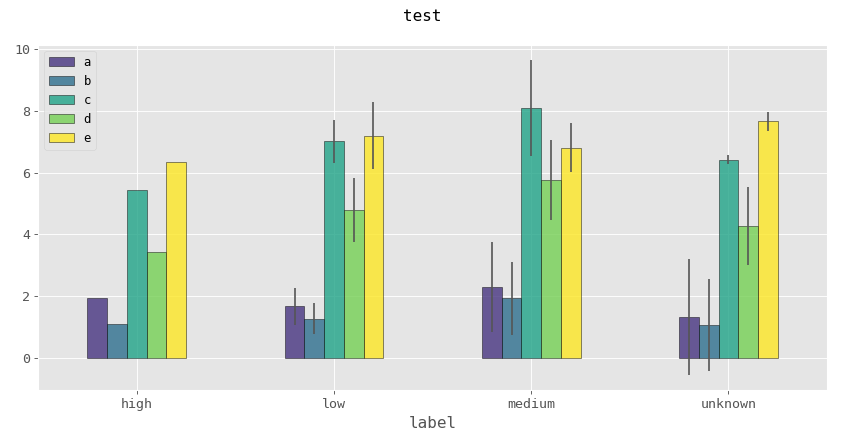
There’s also support for grouped plots.
Multiple sets of tables can be loaded and saved as single projects. There’s a grid layout tool using an interactive table that you can lay out your plots.
Plots can be animated and save as video files using the plot animation options tab. This is designed primarily for time series based line plots but any kinds of plots can be animated. I experienced a few segmentation crashes when using this function.
Next page: Page 3 – Other Features
Pages in this article:
Page 1 – Introduction / Installation
Page 2 – In Operation
Page 3 – Other Features
Page 4 – Summary