This is a series of articles looking at the ASRock Industrial NUC BOX-255H running Linux. In this series, I examine every aspect of this Mini PC in detail from a Linux perspective.
The NUC BOX-255H has the mobile/embedded class 15th generation Intel Core 7 255H processor, based on the Arrow Lake architecture. It offers 16 cores consisting of 6 fast performance cores with up to 5.1 GHz clock speed and 8 smaller efficiency cores with up to 4.4 GHz and two additional “low power” efficiency cores with up to 2.5 GHz.
One key change is that Intel removed Hyper-Threading (HT) in this generation, meaning the Core Ultra 7 255H has 16 threads instead of 20 threads like the Core Ultra 7 155H. However, it makes up for this with better efficiency and faster clock speeds.
We can see the cores using top (or similar utility e.g. htop).
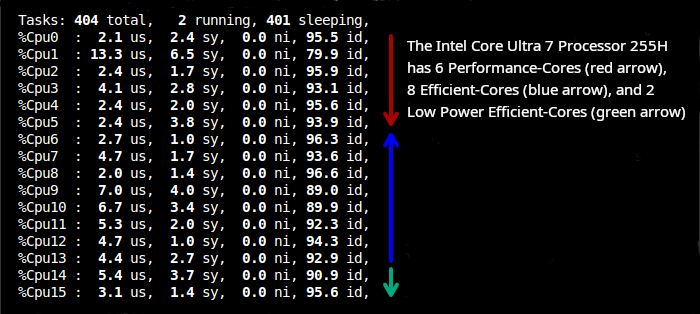
The first 6 cores (%Cpu0 to %Cpu5 inclusive) are the P-Cores. The next 8 cores (%Cpu6 to %Cpu13 inclusive) are the E-Cores. And the final 2 cores (%Cpu14-%Cpu15) are the Low Power Efficient-Cores.
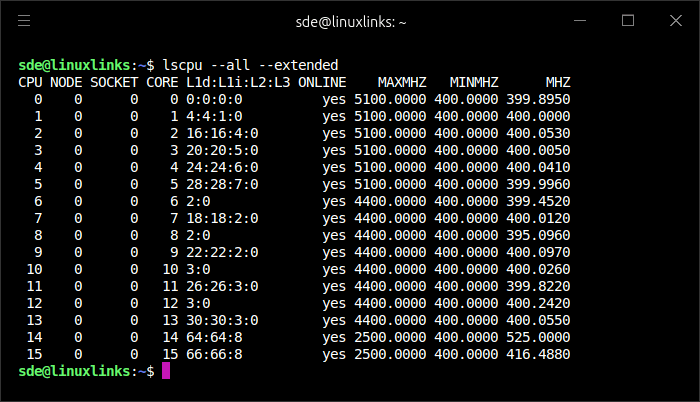
My annotated image is confirmed with the lscpu command as this shows the maximum clock frequencies for each type of core.
$ lscpu --all --extended
I’m interested in seeing the performance difference between the Performance-Cores, Efficient-Cores, and Low Power Efficient-Cores. I can disable cores in the NUC BOX-255H’s BIOS but an easier way is to use the taskset utility.
Let’s take a look at the chess program Crafty using the Phoronix benchmarking suite. It’s a good benchmark to start with as Crafty only uses a single core so it makes results easier to interpret.
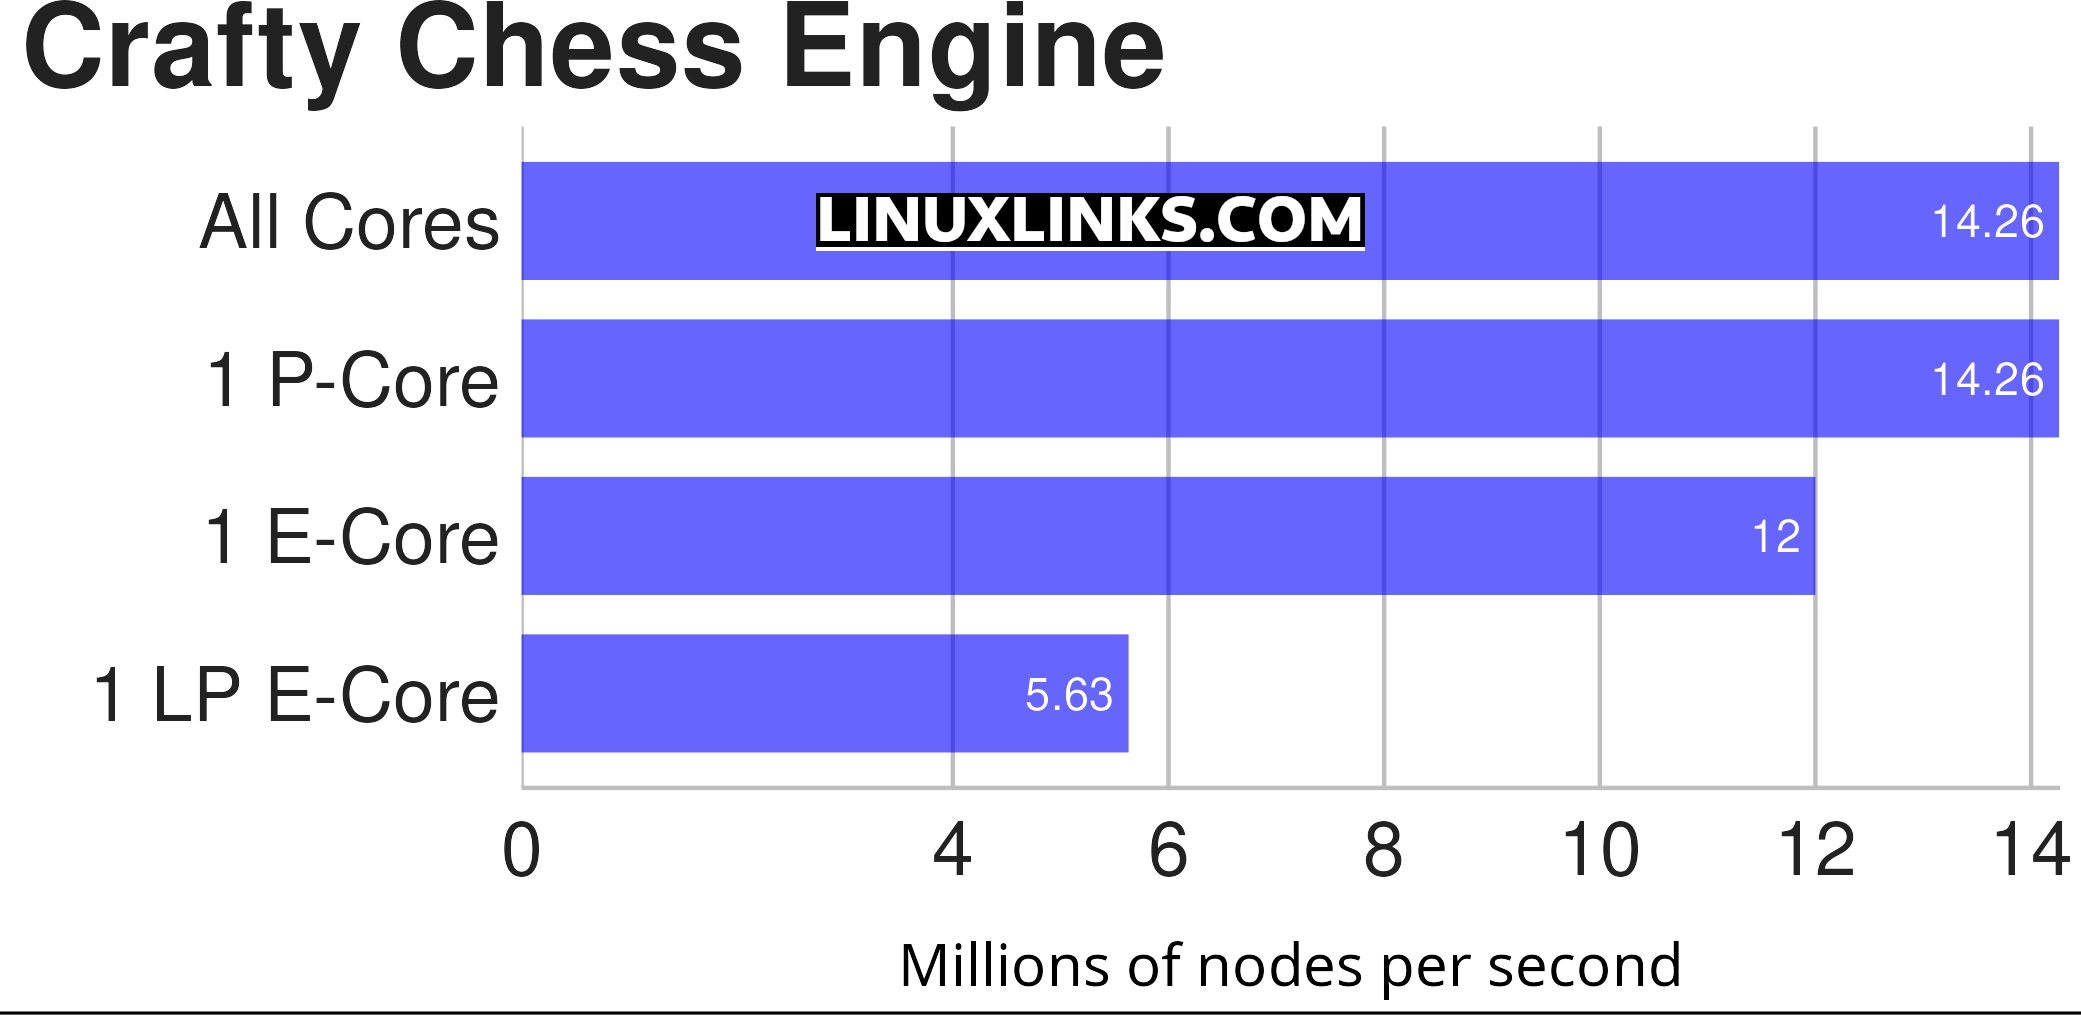
I can run the crafty benchmark on a P-Core, E-Core and LP E-Core with the commands.
taskset -c 0 phoronix-test-suite benchmark crafty
taskset -c 6 phoronix-test-suite benchmark crafty
taskset -c 14 phoronix-test-suite benchmark crafty
As the chart illustrates, an E-Core is slightly more than twice as fast as a Low Power E-Core. And there isn’t much difference between an E-Core and a P-Core now that Hyper-Threading has been removed.
When only one core is being used it runs at its maximum frequency, but the clock speed reduces as more cores are used.
Let’s take the results for Coremark, a benchmark test that uses all the Intel Core Ultra 7 Processor 255H’s cores.
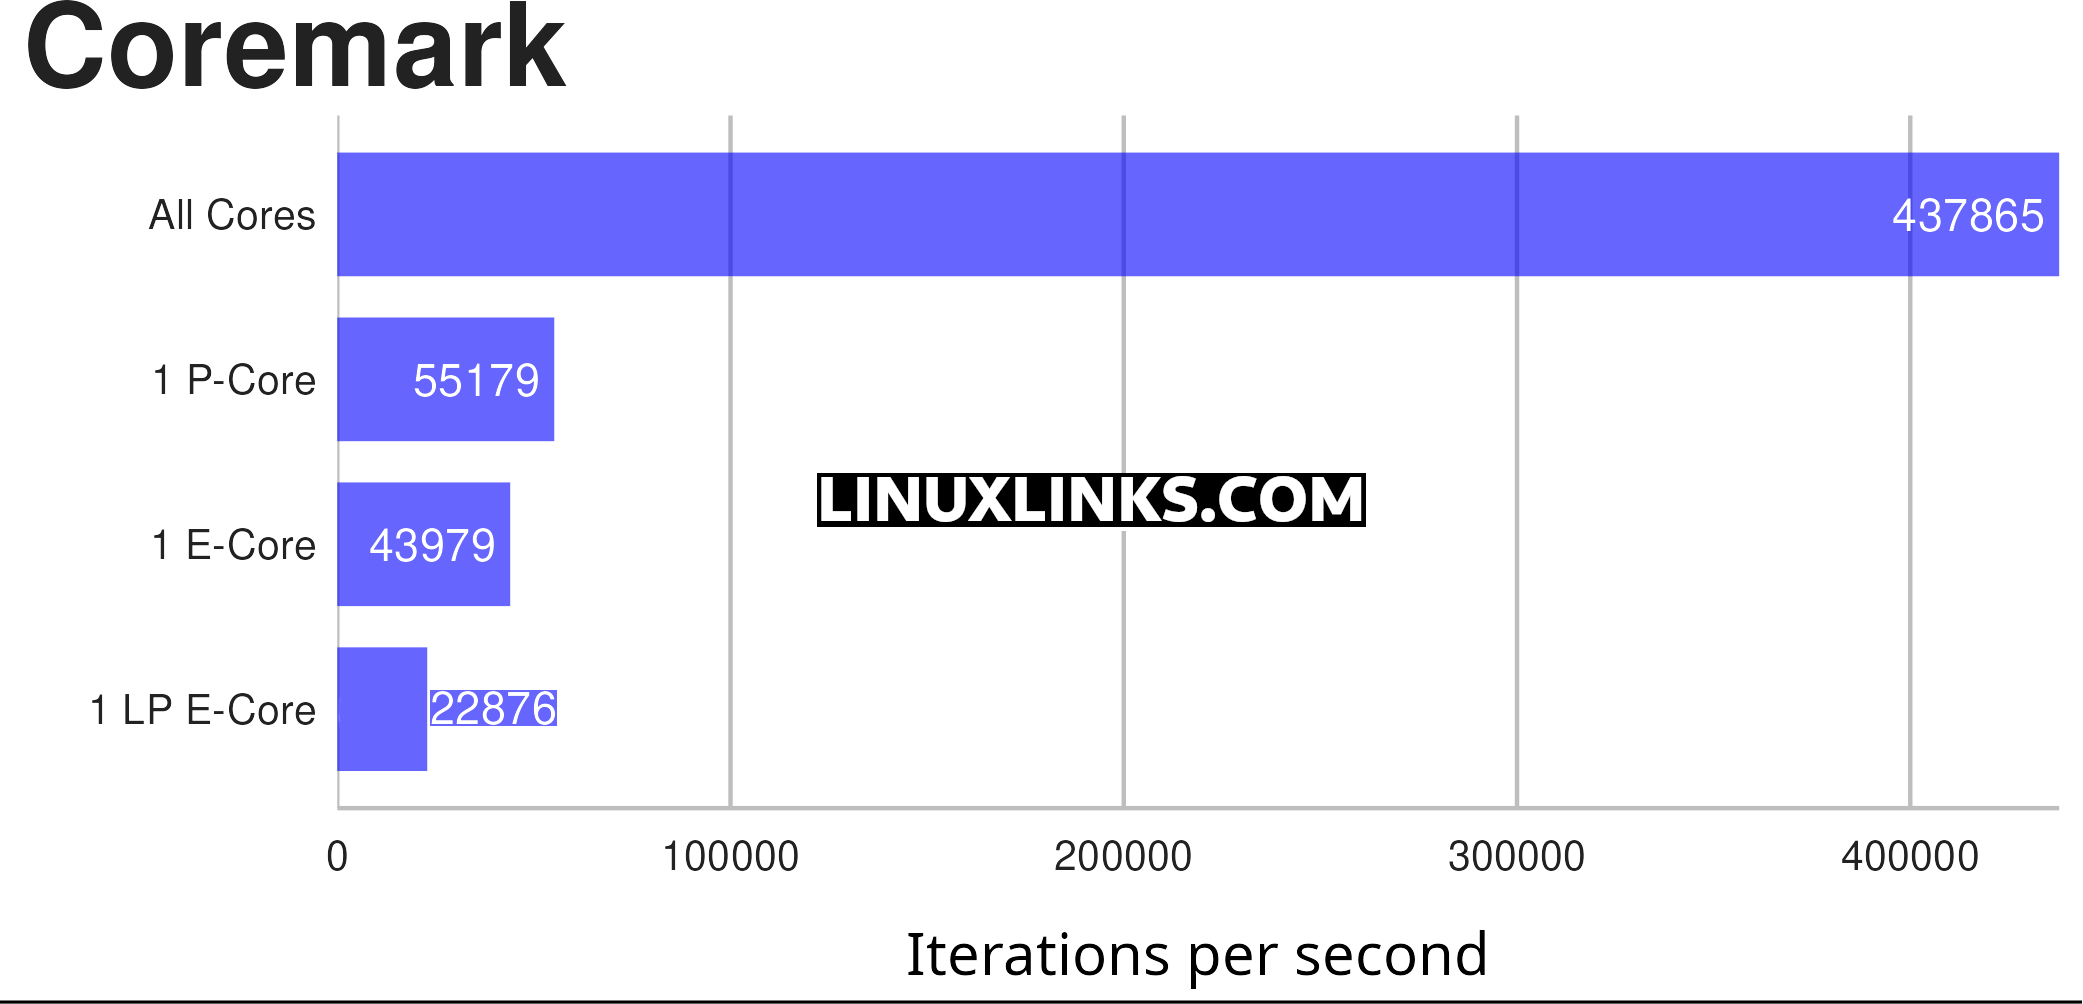
taskset -c 0 phoronix-test-suite benchmark coremark
taskset -c 6 phoronix-test-suite benchmark coremark
taskset -c 14 phoronix-test-suite benchmark coremark
Again a single E-Core’s performance running at its maximum clock speed is about double that of the Low Power E-Core. Given there are 8 E-Cores and only 2 Low Power E-Cores with the Ultra 7 255H, the latter don’t make a significant difference to system performance, but help with power efficiency.
When all cores are stressed, the P-Cores clock down from their maximum of 5.1 GHz to 3.3 GHz, the E-Cores clock down from 4.4 GHz to 3.0 GHz and the Low Power E-Cores clock down from 2.5 GHz to 1.6 GHz.
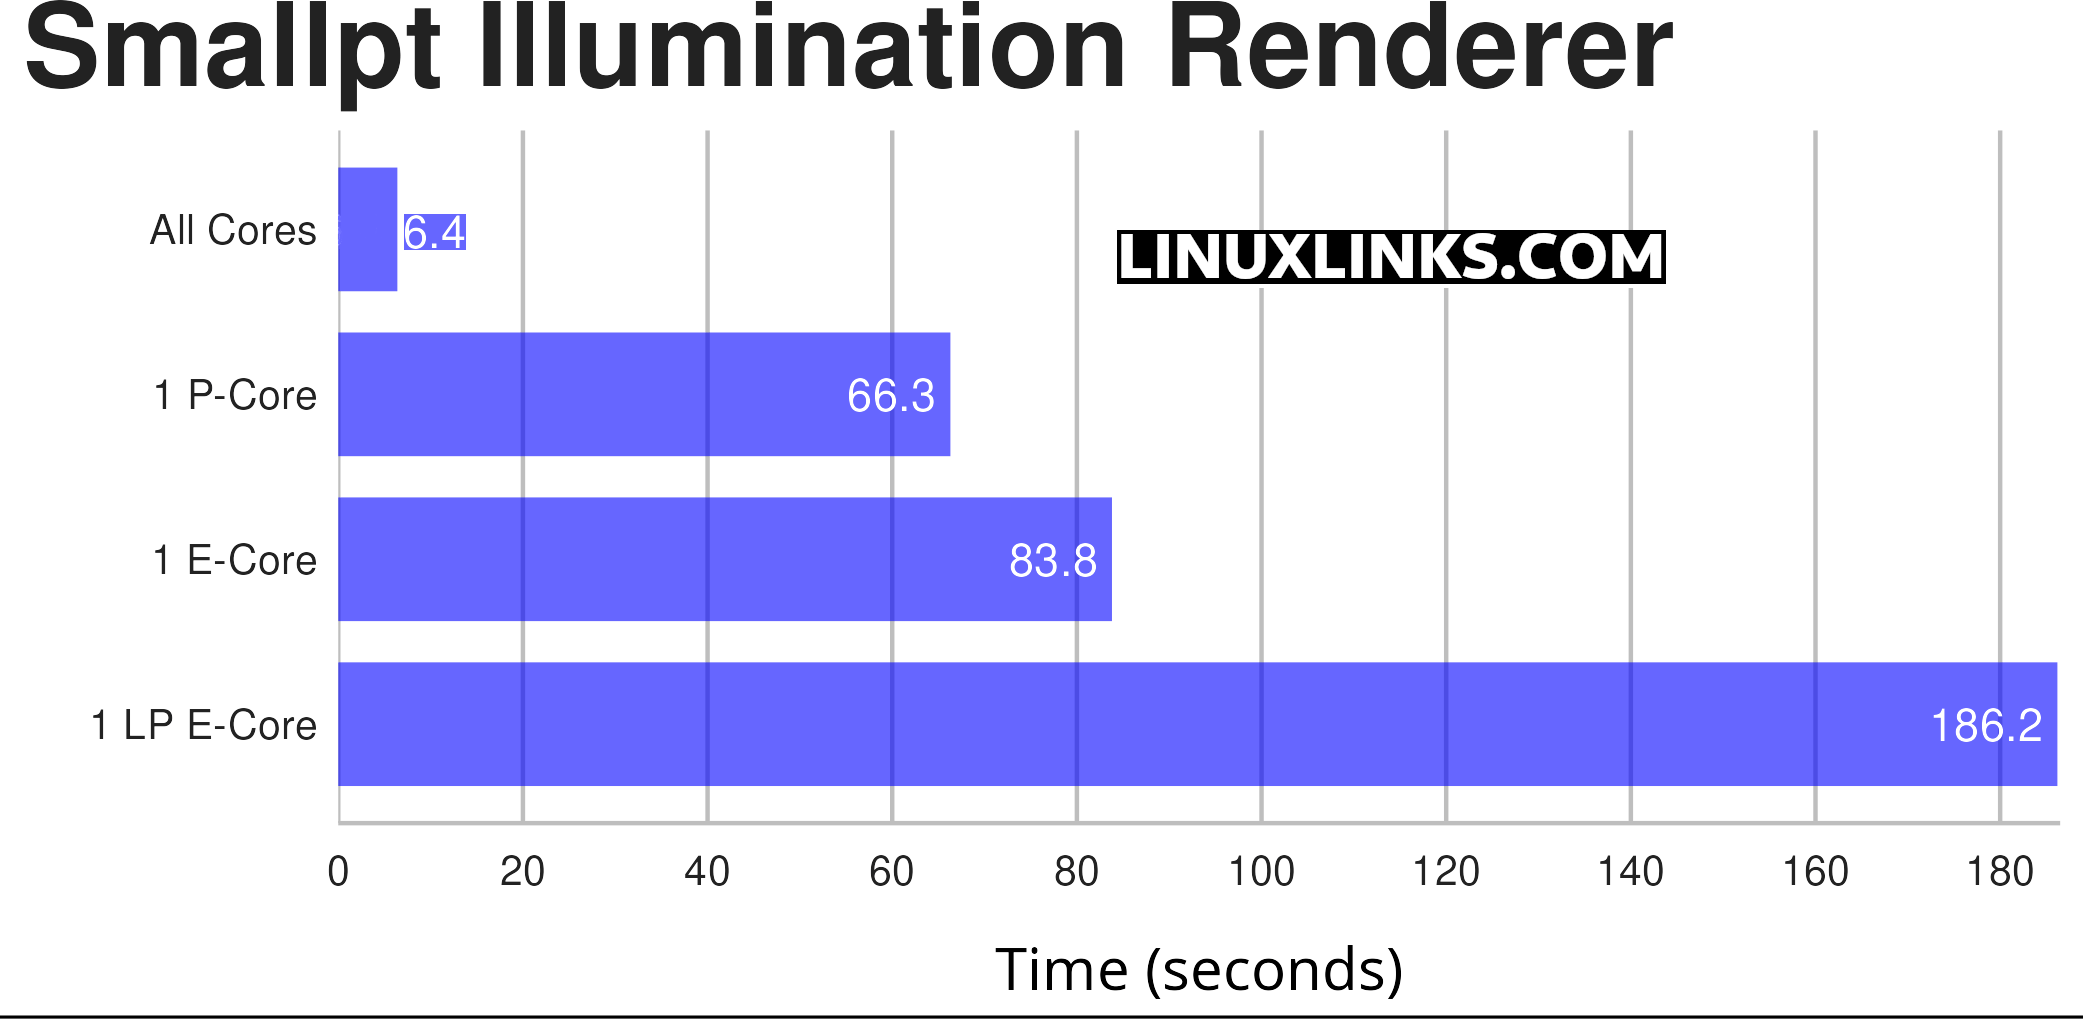
taskset -c 0 phoronix-test-suite benchmark smallpt
taskset -c 6 phoronix-test-suite benchmark smallpt
taskset -c 14 phoronix-test-suite benchmark smallpt
A similar outcome with the Smallpt benchmark. Like Coremark, the benchmark uses all cores, but I’ll use taskset to also test single core performance.
What’s quite interesting is making a comparison with the 13th gen Raptor-Lake-P Core i7-1360p, a processor that was launched 2 years earlier than the Ultra 7 255H, both having a 28W TDP.
The i7-1360p takes 8.9 seconds to complete the benchmark using all its 12 cores (16 threads). So the Ultra 7 255H has the performance edge. But an i7-1360p’s 1 P-Core with HT takes only 51.4 seconds to complete the benchmark (70.9 seconds with 1 P-Core no HT). So the P-Core in this older processor with HT is actually quicker than the P-Core in the Ultra 7 255H processor.
Overall the Ultra 7 255H is comfortably faster than the i7-1360p. The reason is partly because the 255H has 6 P-Cores (4 only with the i7-1360p), and each 255H’s E-Core is much quicker than the i7-1360p E-Core (83.8 seconds to 142.3 seconds respectively). Both processors have 8 E-Cores. The 255H’s 2 additional Low Power E-Cores also help slightly improve the overall benchmark performance.
Complete list of articles in this series:
| ASRock Industrial NUC BOX-255H | |
|---|---|
| Introduction | Introduction to the series and interrogation of the NUC BOX-255H |
| Benchmarks | Benchmarking the NUC BOX-255H |
| Power | Testing and comparing the power consumption |
| Stable Diffusion | Deep Learning with Stable Diffusion |
| Audacity AI Plugins | Let's explore OpenVINO AI Plugins for Audacity |
| 3 Types of Cores | P-cores, E-cores and low power E-cores performance |
| GIMP AI Plugins | Stable Diffusion, Super Resolution, Semantic Segmentation |
| Ubuntu | Upgrading from Ubuntu 25.04 to Ubuntu 25.10 |
| Image Upscaling Tools | A survey of upscaling tools |
| Noise | Comparing the machine's noise with other mini PCs |
| BIOS | Basic Input/Output System |