
Last Updated on November 25, 2022
In Operation
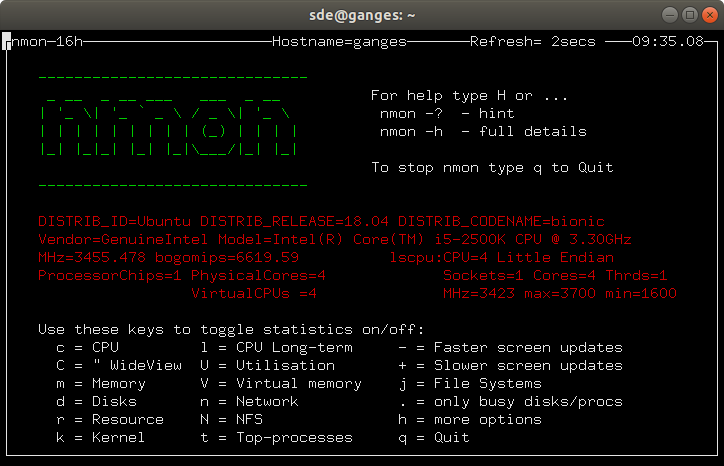
When you run nmon, you’ll see a home page showing some basic information about your system including the distribution, CPU information with BogoMIPS score, and a helpful summary of the various statistics you can toggle. There’s a more detailed “help” screen by pressing h.
What’s not obvious from the starting output is there are two runtime modes available. Besides real-time monitoring, there’s a capture mode where data is saved to a CSV file. This file can be used for processing and graphing. For example, you could run nmon in the background to collate data while running an application. This data can then be loaded into RStudio, a truly awesome IDE for R, to create graphs to examine trends.
For brevity, we’ll look only at the real-time monitoring functionality in this article.
There are some keys that apply to different views. For example, there’s a black and white mode, options to increase/decrease the screen refresh time, and display only busy disks and CPU.
Pages in this article:
Page 1 – Introduction / Installation
Page 2 – In Operation
Page 3 – CPU Stats
Page 4 – Memory Stats
Page 5 – Disk Stats
Page 6 – Kernel Internal Stats
Page 7 – Virtual Memory Stats
Page 8 – Network Stats
Page 9 – Top-processes
Page 10 – Resources
Page 11 – Summary
What terminal/window settings do I use in PuTTY when running nmon to get the correct line drawing?