Stretch Break is an ergonomic support utility that regularly reminds you to take breaks from using your computer,
Read more
The Linux Portal Site

Stretch Break is an ergonomic support utility that regularly reminds you to take breaks from using your computer,
Read more
Astronomy is a branch of science that deals with the study of celestial objects (including stars, planets, moons, comets, asteroids…).
Read more
BMI Calculator is a body mass index calculator built with GTK4 and LibAdwaita.
Read more
wger is a fitness and nutrition manager, with a comprehensive list of exercises and ingredients.It can be self-hosted.
Read more
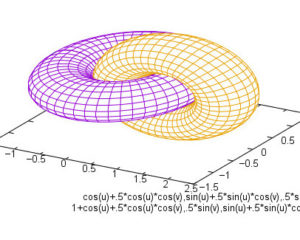
A plotting tool is computer software which helps to analyse and visualize data, often of a scientific nature. Here’s our verdict.
Read more
Xnec2c is a high-performance multi-threaded electromagnetic simulation package to model antenna near- and far-field radiation patterns.
Read more
SasView is a Small Angle Scattering (SAS) analysis package used to analyze 1D and 2D scattering data.
Read more
SSPlot is a simple plotter and numerical solver, which can plot csv style plain text files with numerical data
Read more
suanPan is a finite element method (FEM) simulation platform for applications in fields such as solid mechanics and civil/structural/seismic engineering.
Read more
CRUSH is a free and open source data reduction pipeline and toolkit for specific astronomical imaging arrays.
Read more