RLPlot is a graphical user interface based program for displaying scientific data in standard formats.
Read more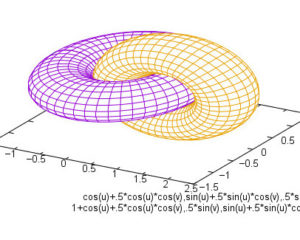
RLPlot is a graphical user interface based program for displaying scientific data in standard formats.
Read more
ZeGrapher is an easy to use math plotter. It can plot functions, sequences, parametric equations and data on the plane.
Read more
matplotlib is a pure Python 2D plotting library designed to bring publication quality plotting to Python.
Read more
Genius Mathematics Tool (Genius) is a general purpose calculator program similar in some aspects to BC, MATLAB or Maple.
Read more
ROOT is an object-oriented program and library developed by CERN, aimed at solving the data analysis challenges of high-energy physics.
Read more
Octave is a high-level language, primarily intended for numerical computations.It provides a convenient command line interface.
Read more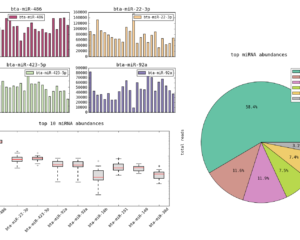
DataExplore is an open source desktop application for data analysis and plotting intended for use in both research and education. It’s targeted at non-programmers who want to perform fairly advanced table manipulation methods. It also offers fast, dynamic plot creation from selected data suitable for publication. A variety of table analysis tools are provided.
Read more