In Operation
The interface is divided into a series of tabs. Here’s a brief overview of each tab.
Systeminfo
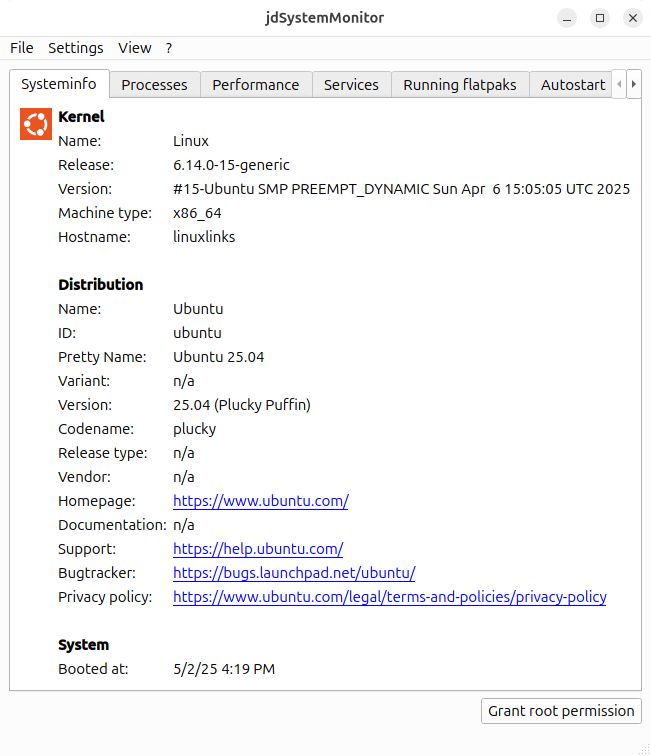
The first tab shows basic system information. As you can see, we’re running Ubuntu 25.04, the current release.
There are many ways of obtaining information about the hardware you are using. The simplest and most reliable source is your system itself. There are plenty of tools that delve deep to find everything you need to know. And if you need assistance from others, they will find the information invaluable. Here’s 15 utilities, scripts and ways to interrogate your PC.
Processes
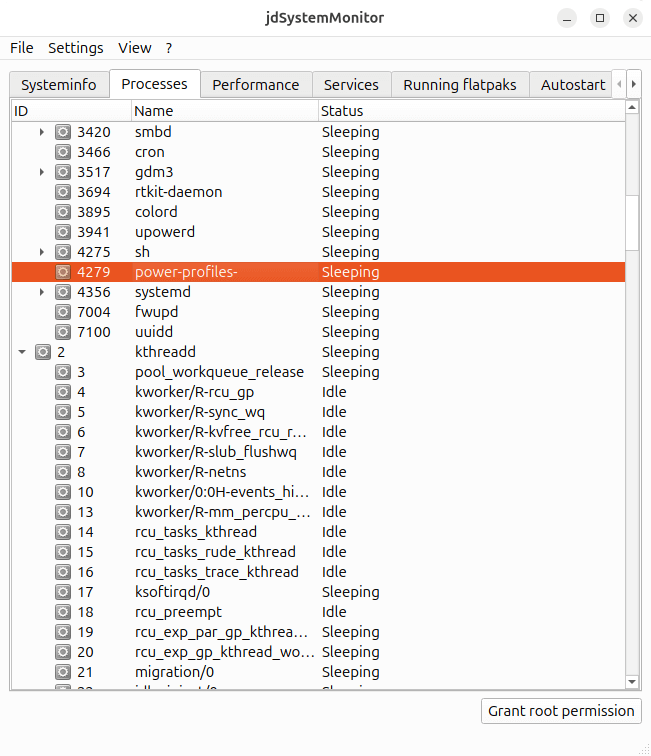
This tab provides detailed information about processes. We can view the properties of each process, send signals to processes (such as kill), as well as set the priority of the process.
All our processes show either as sleeping or idle. We must have some active processes somewhere 🙂
Performance
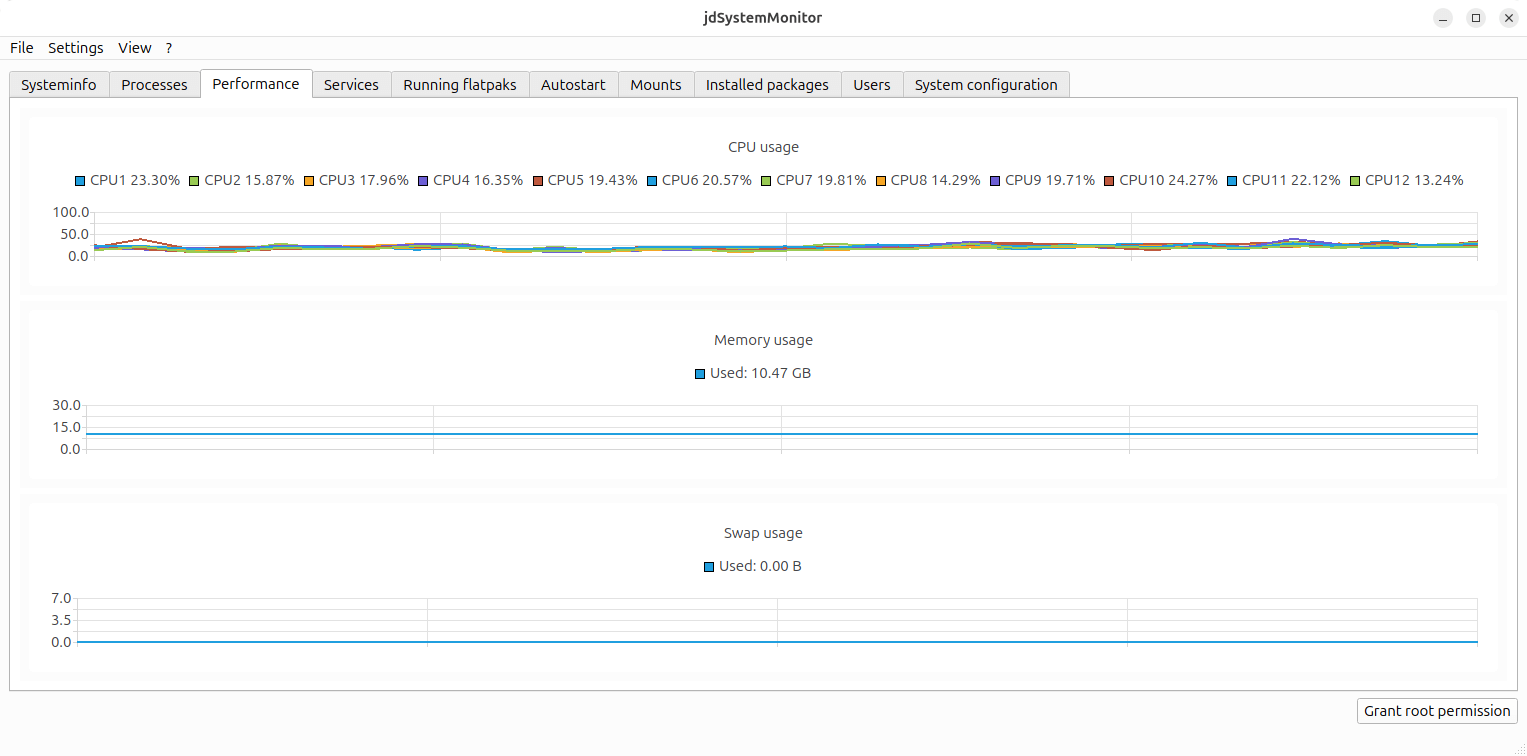
Here we can monitor CPU, memory and swap usage.
There’s definitely room for improvement from an information perspective. Our test system has 6 cores (12 threads), but the CPU chart is fairly unusable compared to System Monitor or Mission Center. And a good system monitor shows a lot more information including drive usage, ethernet usage, and GPU usage. But jdSystemMonitor only saw its first public release last month.
Next page: Page 3 – In Operation: Services, Running flatpaks, Autostart
Pages in this article:
Page 1 – Introduction and Installation
Page 2 – In Operation: Systeminfo, Processes, Performance
Page 3 – In Operation: Services, Running flatpaks, Autostart
Page 4 – In Operation: Other tabs and Summary