
Last Updated on April 16, 2022
SAS Institute Inc. (“SAS”) is an American multinational developer of analytics software based in Cary, North Carolina. The company has around 14,000 employees.
SAS started as a project at North Carolina State University to create a statistical analysis system used mainly by agricultural departments at universities in the late 1960s.
SAS is the name of their software suite that can mine, alter, manage and retrieve data from a variety of sources and perform statistical analysis on it. It has more than 200 components covering areas including statistical analysis, econometrics and time series analysis, an interactive matrix language, data mining and much more.
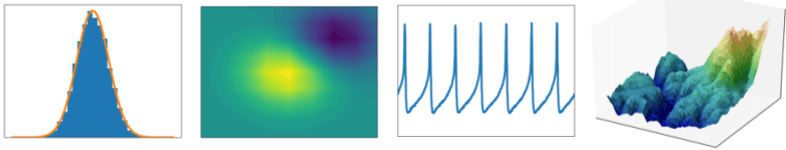
![]() SAS/GRAPH is a data visualization tool that lets you create effective, attention-grabbing graphs. It consists of a collection of procedures that let you produce a variety of charts, plots, 3-D scatter/surface plots, contour plots, and maps with user-defined data.
SAS/GRAPH is a data visualization tool that lets you create effective, attention-grabbing graphs. It consists of a collection of procedures that let you produce a variety of charts, plots, 3-D scatter/surface plots, contour plots, and maps with user-defined data.
SAS is proprietary software. What are the best free and open source alternatives to SAS/GRAPH?
1. matplotlib
matplotlib is a cross-platform, data visualization and graphical plotting library for Python and its numerical extension NumPy. It’s the core on which all static plotting libraries in Python are built. It has a very active community with several toolkits that extend functionality.
Python is a general purpose programming language that uses a collection of libraries for data manipulation, visualisation and statistical analysis. Besides matplotlib, there are a wealth of high quality open source Python visualization tools such as seaborn and plotnine. Here’s an Introduction to Python for Data Science which uses plotnine.
2. ggplot2
ggplot2 is a system for declaratively creating graphics, based on The Grammar of Graphics. You provide the data, tell ggplot2 how to map variables to aesthetics, what graphical primitives to use, and it takes care of the details.
ggplot2 is an excellent R package. You can build almost any type of chart with this package. There are lots of functions to annotate graphs, customize graphs to your exact requirements, together with a set of pre-built themes.
R is a statistical programming language that can be used for data manipulation, visualisation of data and statistical analysis. The R language consists of a set of tokens and keywords and a grammar that you can use to explore and understand data from many different sources. Here’s an Introduction to R for Data Science which illustrates how to get started with ggplot2.
3. gnuplot
gnuplot plots functions and data points in both two- and three-dimensional plots in many different styles and many different output formats.
The software can also be used as a scripting language to automate generation of plots, and is designed primarily to visualize scientific data. You’ll need to invest a good chunk of time to exploit some of its advanced features.

For other high quality open source alternatives, read this article.
All articles in this series:
| Alternatives to SAS's Products | |
|---|---|
| Base SAS is a fourth-generation programming language (4GL) for data access, data transformation, analysis and reporting. It is included with the SAS Platform. | |
| JMP (pronounced “jump”) is a suite of computer programs for statistical analysis. JMP software combines interactive visualization with powerful statistics. | |
| SAS Enterprise BI Server provides a solid basis for vendor consolidation and BI standardization, enabling IT to focus on more effectively aligning with the business. | |
| SAS Enterprise Miner aims to streamline the data mining process. It helps you analyze complex data, discover patterns and build models so you can more easily detect fraud, anticipate resource demands and minimize customer attrition. | |
| SAS/ETS provides SAS procedures for econometric analysis, time series analysis, time series forecasting, systems modeling and simulation, time series data management, and more. | |
| SAS/GRAPH is a data visualization tool that lets you create effective, attention-grabbing graphs. It consists of a collection of procedures that let you provide a variety of charts, plots, 3-D scatter/surface plots, and more. | |
| SAS/IML is a powerful, flexible matrix programming language for interactive and exploratory data analysis. | |
| SAS/INSIGHT is a tool for data exploration and analysis. Explore data through graphs and analyses linked across multiple windows. | |
| SAS/STAT provides tools and procedures for statistical modeling of data. It includes analysis of variance, linear regression, predictive modeling, statistical visualization techniques and a lot more. |
|